Radiation Dose Chart
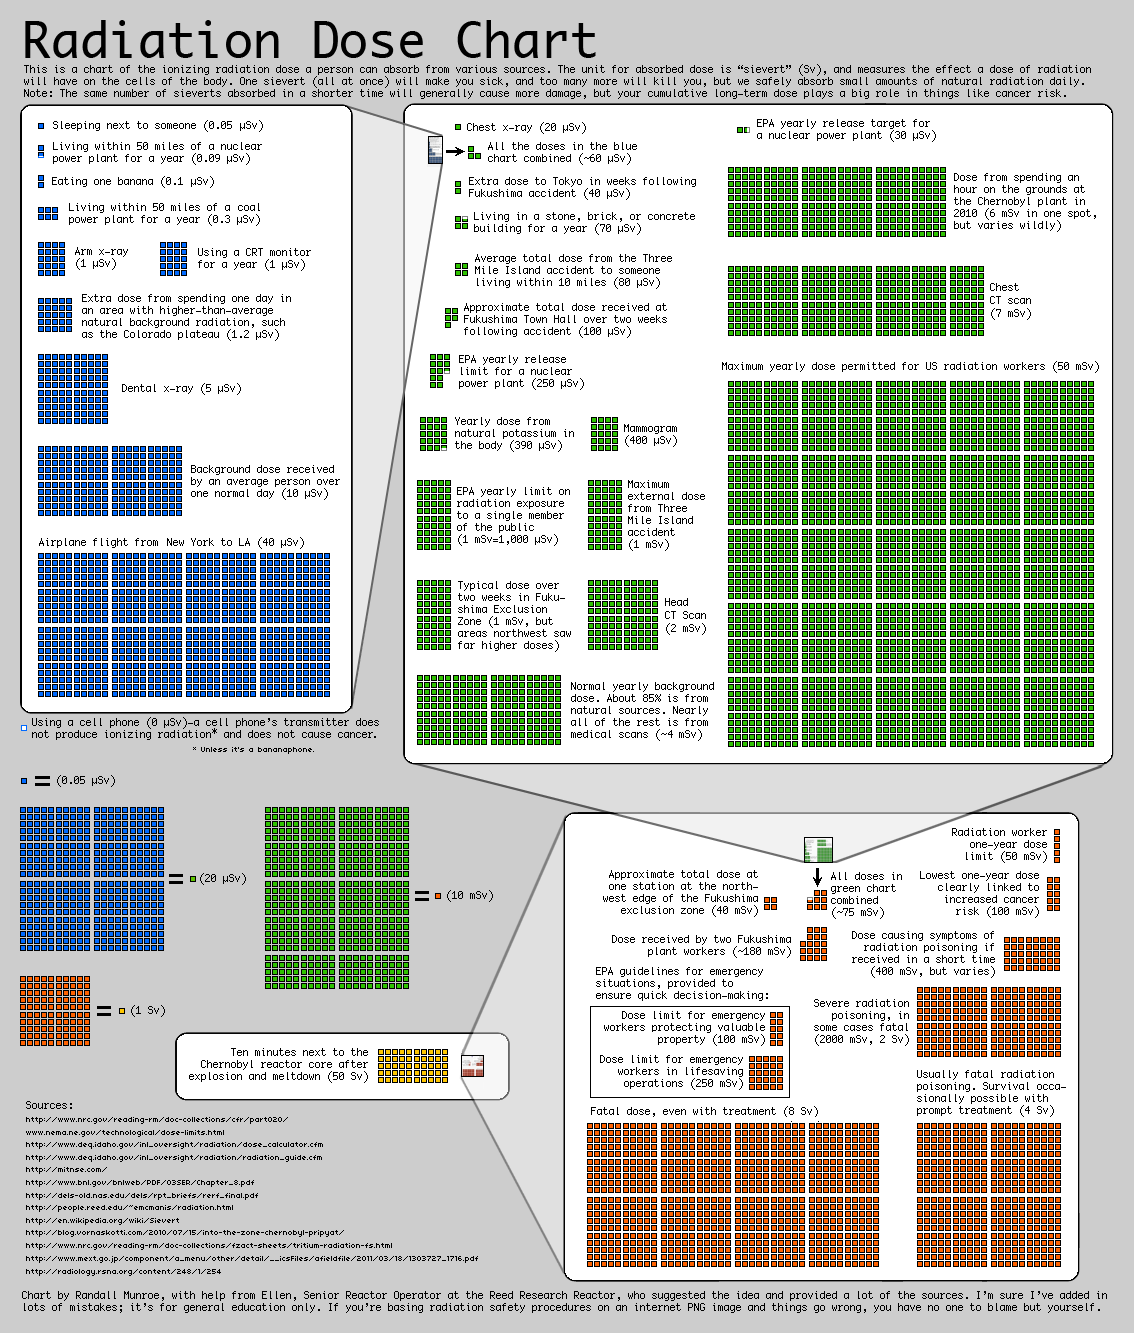
We absorb radiation daily from different, very different, sources.About this, the numbers and scales in the graph below, taken from xkcd.com, are very interesting.
However keep in mind that the risk of harm depends (but not only) on both the dose and the exposure time.
From the chart: "the same number of sieverts absorbed in a shorter time will generally cause more damage, but your cumulative long term dose plays a big role in things like cancer risk."
Note: the different color indicate the different scales (muSv, mSv, Sv and "tens"(!!!) of Sv)


Comments